This is the third in a series of articles to start your journey into SRE. In the first part of this series, we discussed MADARR and its relationships with the DevOps principles of continual development and continual improvement. The Second Article introduced the concepts of Observability and discussed the first stage in the journey outlined in the diagram below.

In this article, we will delve deeper into the secret arts of SRE, but before we move on, let’s briefly recap the first part of this post, where we introduced MADARR and Observability.
Brief Recap
As already mentioned in part one of the series, we introduced the prime concept of SRE, that of MADARR. Measure, Analyse, Decide, Act, Reflect, and Repeat, which is the infinity loop of the SRE. It posits that complete cover monitoring or total Observability will remove the dark spots that hide unknown unknowns. Site Reliability Engineers need the information gathered through Observability to correctly analyse the end-to-end solution and identify weak service areas. This information will enable them to decide where better to act to improve customer end service; after which there is a period of reflection to analyse improvements, followed by a new cycle of MADARR.
The second post introduced Observability and how it differed from monitoring. The article then discussed the low-hanging fruit of code pipelines which formalise IaC and application installation and configuration, and load and scale consulting in reducing toil and improving service resilience by allowing the environment to be built correctly sized for purpose and scaled for future expansion.
So let’s move on to phase two, where we introduce the core concepts of Site Reliability Engineering. The image above states this is classed as a pilot stage. Still, it could easily be argued that it is building the foundations for migration from Operations based on reaction to Operations based on continual improvement. Here we start to look deeper at procedural and structural changes to processes that an IT department or MSP uses to deliver Service to their users and clients.
Monitoring? I thought we were all about Observability!
The biggest issue with monitoring is that traditionally it is silo’d. You have the network team monitoring the network devices, the security team monitoring access and potential breaches, and the Wintel and Lintel teams monitoring their operating systems and any physical servers or desktops. Finally, you have the storage teams, the various application and Database teams who also have their silos. It is like looking at the sky at night with a telescope point and a star and missing the meteor storm. You hopefully have full knowledge of your sphere of influence. However, every silo has no knowledge or visibility regarding the information contained in any other silo; this can lead to finger-pointing and a “them and us” mentality. McKinsey calls this the silo syndrome. Gillian Tett in The Silo Effect stated, “Silos can create tunnel vision, or mental blindness, which causes people to do stupid things”.
Observability fills the gaps and centralises knowledge in a shared repository. This allows a Site Reliability Engineer to have greater visibility of the end-to-end processes that make up a service. Again, think back to the three tiers of Observability: Metrics, Logs and Traces. By possessing all the cards in the deck, an SRE can pinpoint the weak points and identify where a service could be improved and how to implement that change.
Observability also removes the Plausible Deniability of “it’s not our problem, our tooling shows no issues”, too.
Tools like LM Envision from LogicMonitor provide a holistic view of end-to-end processes and provide tooling to provide a statement on “good” by combining traditional Server, storage and network monitoring with APM (Application Performance Monitoring).

On-call and Blameless Post-mortems
On-Call is a standard part of many an operational role; the chances that a large majority of this article’s readers have been “on-call” at one time or another is high. On-Call has traditionally been performed by the Operations team, with the more senior staff held in reserve to be called in like the cavalry riding over the ridge to save the day. The core reason for On-Call is to guarantee legacy concepts of 5 x 9’s and SLA response times. This is because, traditionally, the junior staff are on call. These junior staff members are expected to triage a fault and start remediation; this is the wrong starting point because it often leads to an extended time to service restoration (MTTR); precisely the wrong outcome that your clients desire. One of the more controversial tenets of SRE is that SRE Team members are on call; SRE Team members are, by necessity Senior and expensive resources that have several years working on their careers and honing their skills. This makes sense because having your SREs on call will reduce the time to identify the issue and the time to remediate the fault. Other than the potential political fallout of having senior staff on first-line support, this is one of the easier procedural changes to implement and has a significant effect on Incident Management. Senior Technical staff bring a sense of calm to an environment, have a breadth of knowledge across multiple disciplines and are seen as leaders.
Once the incident is concluded, whether successful or not, there should be a wash-up, or to use SRE parlance, a Post-Mortem. A core tenet in SRE is a lack of Blame; everything is a learning experience. Remember MADARR. Where there is a blame culture, things that need to be aired in the open are hidden for fear of reprisal. The concept of a blameless culture originated in the spheres of Healthcare and Aviation, both areas where mistakes can often be fatal. The idea of Blamelessness is one of the hardest procedural tenets to implement; finger-pointing and deniability are culturally embedded in Western Businesses. This, coupled with a lack of trust in leadership and a culture of putting things in your back pocket for later use as favours and leverage, is an illness and drug that is hard to wean management and co-workers off.
Blameless Post-Mortems are about understanding the what, the why of a problem and the how to prevent it from happening again and improving the processes surrounding the affected Service. Therefore, the circumstances that will give cause to raise a post-mortem must be defined before the policy is implemented. That said, a process must be in place to enable ad-hoc post-mortems to be submitted on request by a stakeholder.
The more common Post-mortem triggers are:
- User-visible downtime or degradation beyond a certain threshold
- Data loss of any kind
- On-call engineer intervention (release rollback, rerouting of traffic, etc.)
- A resolution time above some threshold
- A monitoring failure (which usually implies manual incident discovery)
A post-mortem must not be seen as a punishment but as a learning opportunity for the team working on the issue and the company as a whole. Although, by necessity, these will be expensive meetings, your SRE team members, Incident managers, and key stakeholders will need to be present. This is a formal process.
It cannot be reiterated enough that in a post-mortem. However, a formal process is a learning opportunity when carrying out the post-mortem; it is imperative that there is a shift from allocation of Blame to the investigation of systematic reasoning as to why an individual or team had incorrect or incorrect information. You cannot “fix” people, but you can fix systems and processes to support better the people making the decisions, allowing them to make the correct choices when designing and maintaining complex systems.
Some level of Post-Mortems should be a part of every process undertaken by the IT teams, be that initial implementation, a service change or an incident. It should become a part of standard operating procedures, a way to imbue good practice and continual improvement into everyday work.
Consolidated and Searchable Logging
There is no fixed procedure for logging; every organisation has different differing needs and requirements. OK! Hang on a minute; we already do log consolidation and custom searching. Does that not mean that we are already doing SRE? Most likely not! You may have log consolidation, possibly, tactically, maybe. However, it will most likely be silo-based and aligned along the traditional Silos of Network, Security, WinTel/LinTel, storage etc., along with your monitoring solutions. So again, we are zeroing in on a star and missing the meteor shower.

Remember that SRE is elevating the view from the micro to the macro; by taking your already consolidated logs and forwarding the results to a higher tier, you are elevating and consolidating your knowledge in a single source of truth to be able to act in a strategic rather than a tactical manner. However, this process can potentially raise issues this solution can become a single point of failure. These services need to be resilient; therefore, consideration must be placed on service availability. An SRE Engineer’s last need is to find that their secret source of total Observability has disappeared due to a service failure; that would be ironic in the extreme.
Opensource Tools like Prometheus, when coupled with Grafana, can solve this problem by providing a resilient solution deployed on a Kubernetes platform. However, building this solution from scratch is not for the faint of heart. Both require a significant learning curve to provide a return on time invested in their deployment.
However, commercial tooling like Datadog or LogicMonitor provides a paid-for option that is SaaS-based. This will cover the issues of resilience and the steep learning curve of initial product installation and configuration. The SRE engineer can concentrate on the product’s outputs rather than the product’s management.
SLI/SLO reviews with Product Managers and Applications Owners
Traditionally an IT Operations department will deal with the concept of an SLA or a service level agreement. These agreements are predicated on the amount of time a particular service can be down per day, week, month or year. Failure to reach these arbitrary timescales will be penalised based on the strictures in the associated business contract.
SLA typically contain calculations around minutes of uptime for the Service over time.
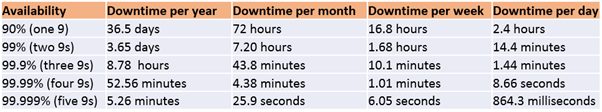
For example, an SLA of 99.9%, termed a three 9s uptime, will allow for 1m 44s of downtime per day. Therefore, this downtime is 10.1m, 43.8m, and 8.78h of downtime per week, month, and year, respectively, as shown above in the matrix.
Although the concept of an SLA is helpful from a contractual perspective, it has no real value when providing Service. This is where SLO and SLI enter the fray.
Definition time
Service Levels Objectives (SLOs) are the agreements between the SRE teams and the product owners or line of business (LOB). The metrics heavily depend on the nature of the system the team is managing.
Service Level Indicators (SLIs) are the quantitative measures defined for a system, or in plain language, “what we are measuring.” The indicators will be very dependent on the system under management.
We now have the definitions, but how do we use them?
Let us look at a typical web application; here, our Service Level Indicators (SLI) could be Service availability, the time it takes for a Service response or request latency, or a measure of the number of request failures or error rates. However, when looking at a Blockchain application, The SLI could focus on the endorsement and ledger commit rates per second to measure the network’s throughput.
It is a given that an SRE team will manage multiple systems. This will mean that defining a standard set of SLIs definitions across various applications will help the team to standardise monitoring, logging, and automation across the stack. Remember, like a code variable, an SLI Definition is a standard naming convention, and the value of the SLI metric may vary depending on the Service the SLI is aligned to.
This leads us to the concept of the SLO. SLOs are the target value or range the system should operate or, in plain language, “how good should it be.” An SLO is the expected operational value for the aforementioned SLI. For example, taking our blockchain network SLI, our SLO could be that the network has to sustain a transaction throughput of 50 to 100 transaction commit rate with less than 5 seconds of end-to-end latency.
Engineers being Engineers, there might be a tendency to overthink and define SLI and SLOs. It is essential to keep them simple in the beginning, do not attempt to run before you can walk. As the SREs’ understanding of the system grows over time, stricter targets can be set.
Taking on SRE does not mean that we are losing the Service Level Agreement (SLA). SLAs are a valid construct at the business level and only come into play when the customer is unhappy about the Service rendered or there has been a failure to deliver according to the agreement in question. A better perspective to place on an SLA is to consider the SLA as follows:
“SLA = Missed SLO + SLI + consequences.”
The SRE teams may not be involved in defining contract SLAs, but they need to make sure SLOs are met, as a failure to reach an SLO will result in an SLA transgression and the triggering of whatever penalties are associated with the SLA.
Infrastructure as Code and Configuration Management
The final cog in the SRE Pilot is the well-worn IaC and Config Management path. If you’re not leveraging IaC, you are not all you can be as an SRE. Therefore, we will not define IaC and Configuration Management, but we will investigate why it is a crucial part of an SRE’s tool kit.
The benefits of IaC, namely time-saving and repeatability, apply to SRE and almost any IT or development team. However, for SREs in particular, IaC offers some critical advantages when it comes to engineering reliability:
- Easier collaboration: IaC helps SREs collaborate more effectively with other types of teams. It eliminates the risk that reliability guidance will be lost in translation or forgotten when it comes time to apply it.
- Tracking reliability issues over time: This becomes very valuable in the event of an outage or reliability issues, and SREs want to know whether a change in infrastructure configuration correlates with the incident. This data can be crucial for remediating the problem and performing incident post-mortems.
- Lower risk of human error: One of the greatest enemies of site reliability is fat-fingered syndrome or human error. IaC significantly reduces this risk by allowing teams to apply configurations automatically. As a result, your infrastructure will be more resilient.
- Validate reliability configurations before deployment: Another benefit of IaC for SREs is that IaC can scan a configuration automatically before deployment. Therefore SREs can validate deployment configurations before they go live. How SREs can adopt IaC
The best IaC platform for a given SRE team will depend mainly on which environment a team manages. For example, some IaC tools only support certain public clouds, Bicep (Azure), Cloud-Formation (AWS), and if you are only working within those constructs, it is not an issue; whilst others (Terraform, Pulumi) can work anywhere. Likewise, how you scan IaC files depends on which IaC tool is used, so research should be done to determine which scanning and validation processes IaC platforms support before choosing one.
Conclusion
This has been a particularly long post, which has covered a lot of ground. However, suppose you have carried out these processes in your environment. In that case, you are well on your journey to running SRE and elevating your company’s operations to be based on Customer outcome and prevention rather than meaningless SLAs and reactive approach to Service resilience. The final post in this series will look at elevating your SRE from the initial introductory steps to a full-on SRE Practice.
We will move to proactively trace critical Services performance and create synthetics to monitor and show “Good”. Further, we will introduce resilience practices such as Blue/Green and Canary deployments, APM, and preventative actions such as Scaling and capacity management. Finally, we will discuss the holy grail of chaos engineering, where the SRE Team introduces faults to systems to find and repair services to reduce single points of failure.
If you have questions related to this topic, feel free to book a meeting with one of our solutions experts, mail to sales@amazic.com.